
Chart Canvas MCP Server
Enables AI assistants to create interactive charts, diagrams, and tables displayed on a real-time dashboard, supporting multiple data sources with privacy-focused local execution.
README
Chart Canvas MCP Server
Interactive visualization dashboard for AI assistants via Model Context Protocol
Create beautiful charts, diagrams, and tables directly from your AI conversations. Chart Canvas provides a real-time dashboard that displays visualizations as you work with LLMs like Claude.
Demo
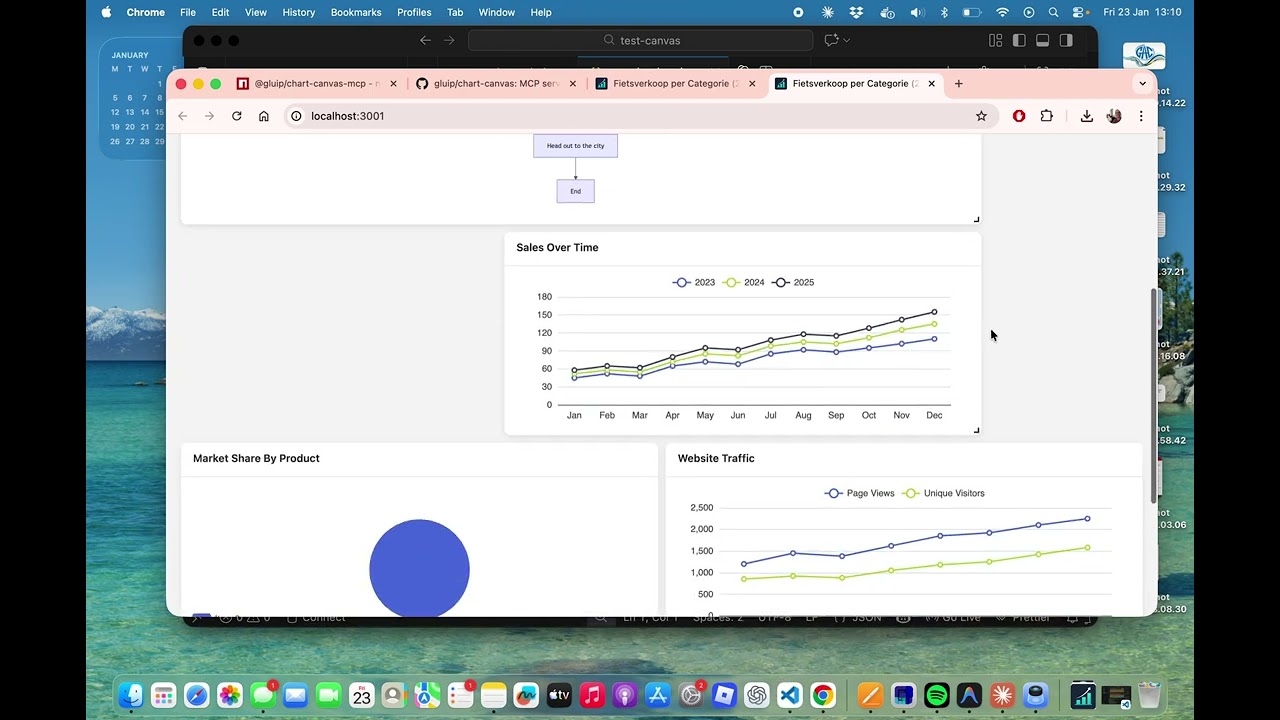
Watch the full demo on YouTube to see Chart Canvas in action!
Features
✨ Multiple Chart Types: Line, bar, scatter, pie charts, tables, and Mermaid diagrams
🎨 Interactive Dashboard: Drag-and-drop grid layout with real-time updates
🔄 Live Synchronization: Changes appear instantly in your browser
📊 Rich Visualizations: Powered by ECharts and Mermaid
💾 Universal Data Sources: Query SQLite, CSV, Parquet, JSON, and NDJSON files directly
⚡ Smart Data Flow: Execute queries server-side - data stays local, never sent to LLM
🔒 Privacy First: Your data never leaves your machine
🚀 Easy Setup: One command to get started
🌐 Production Ready: Built-in production mode with optimized builds
Supported Data Sources
Chart Canvas can query and visualize data from multiple file formats:
- SQLite (
.db,.sqlite,.sqlite3) - Relational databases - CSV (
.csv) - Comma-separated values - Parquet (
.parquet) - Columnar storage format - JSON (
.json) - JSON arrays of objects - NDJSON (
.jsonl,.ndjson) - Newline-delimited JSON
Privacy & Performance: All queries execute locally on your machine using DuckDB. Query results are transformed into visualizations server-side - only metadata (chart configuration) is sent to the LLM, never your actual data. This makes it fast, scalable, and private.
Quick Start
Installation
npm install -g @gluip/chart-canvas-mcp
Or use directly with npx (no installation needed):
npx @gluip/chart-canvas-mcp
Configuration
Add to your MCP client configuration (e.g., Claude Desktop):
macOS: ~/Library/Application Support/Claude/claude_desktop_config.json
Windows: %APPDATA%/Claude/claude_desktop_config.json
{
  "mcpServers": {
    "chart-canvas": {
      "command": "npx",
      "args": ["-y", "@gluip/chart-canvas-mcp"]
    }
  }
}
Usage
- Start your MCP client (e.g., Claude Desktop)
- The server will automatically start on port 3000
- Use the
showCanvastool to open the dashboard in your browser - Ask the AI to create visualizations!
Example Prompts
"Show me a line chart comparing sales data for 2023 and 2024"

"Create a pie chart showing market share by region"

"Draw a flowchart for the user authentication process"

"Make a table with team member information"

"Show me the database schema for my SQLite database"

"Query the athletes table and show the top 10 with most personal records"

"Create a chart showing sales trends from the database grouped by region"
MCP Tools
addVisualization
Create charts, diagrams, and tables on the canvas.
Supported Types:
line- Line charts with multiple seriesbar- Bar charts for comparisonsscatter- Scatter plots for data distributionpie- Pie charts with labelstable- Data tables with headersflowchart- Mermaid diagrams (flowcharts, sequence diagrams, Gantt charts, etc.)
Example:
{
  type: "line",
  title: "Monthly Sales",
  series: [
    { name: "2023", data: [[1, 120], [2, 132], [3, 101]] },
    { name: "2024", data: [[1, 220], [2, 182], [3, 191]] }
  ],
  xLabels: ["Jan", "Feb", "Mar"]
}
removeVisualization
Remove a specific visualization by ID.
clearCanvas
Remove all visualizations from the canvas.
showCanvas
Open the dashboard in your default browser.
getDatabaseSchema
Inspect the structure of a SQLite database to understand available tables and columns before writing queries.
Parameters:
databasePath- Path to SQLite database file (e.g.,./data/mydb.sqliteor absolute path)
Example:
{
  databasePath: "/path/to/database.db";
}
Returns: Formatted schema showing all tables, columns, data types, and constraints.
queryAndVisualize
Execute a SQL query on a SQLite database and create a visualization from the results. Queries are executed server-side and must be read-only (SELECT only). Maximum 10,000 rows.
Parameters:
databasePath- Path to SQLite database filequery- SQL SELECT query (read-only)visualizationType- Type of chart:line,bar,scatter,pie, ortablecolumnMapping(optional for table) - Mapping of columns to chart axes:xColumn- Column for X-axis (required for charts)yColumns- Array of columns for Y-axis (required for charts)seriesColumn- Column to group data into separate series (optional)groupByColumn- Alternative grouping column (optional)
title- Optional title for visualizationdescription- Optional descriptionuseColumnAsXLabel- If true, use X column values as labels instead of numbers
Example:
{
  databasePath: "./data/sales.db",
  query: "SELECT region, SUM(revenue) as total FROM sales GROUP BY region",
  visualizationType: "bar",
  columnMapping: {
    xColumn: "region",
    yColumns: ["total"]
  },
  title: "Revenue by Region",
  useColumnAsXLabel: true
}
Security: Only SELECT and WITH (CTE) queries are allowed. INSERT, UPDATE, DELETE, DROP, and other modifying operations are blocked.
Architecture
- Backend: Node.js + TypeScript + Express + MCP SDK
- Frontend: Vue 3 + ECharts + Mermaid + Grid Layout
- Communication: Real-time polling for instant updates
Development
Local Development
# Clone repository
git clone https://github.com/gluip/chart-canvas.git
cd chart-canvas

# Install backend dependencies
cd backend
npm install

# Install frontend dependencies
cd ../frontend
npm install

# Development mode (backend + frontend separate)
# Terminal 1 - Backend
cd backend
npm run dev

# Terminal 2 - Frontend
cd frontend
npm run dev

# Production mode (single server)
cd backend
npm run build:all
npm run start:prod
MCP Configuration for Local Development
{
  "mcpServers": {
    "chart-canvas": {
      "command": "/path/to/node",
      "args": [
        "/path/to/chart-canvas/backend/node_modules/.bin/tsx",
        "/path/to/chart-canvas/backend/src/index.ts"
      ]
    }
  }
}
License
MIT © 2026 Martijn
Links
Recommended Servers

playwright-mcp
A Model Context Protocol server that enables LLMs to interact with web pages through structured accessibility snapshots without requiring vision models or screenshots.

Audiense Insights MCP Server
Enables interaction with Audiense Insights accounts via the Model Context Protocol, facilitating the extraction and analysis of marketing insights and audience data including demographics, behavior, and influencer engagement.

Magic Component Platform (MCP)
An AI-powered tool that generates modern UI components from natural language descriptions, integrating with popular IDEs to streamline UI development workflow.

VeyraX MCP
Single MCP tool to connect all your favorite tools: Gmail, Calendar and 40 more.

graphlit-mcp-server
The Model Context Protocol (MCP) Server enables integration between MCP clients and the Graphlit service. Ingest anything from Slack to Gmail to podcast feeds, in addition to web crawling, into a Graphlit project - and then retrieve relevant contents from the MCP client.

Kagi MCP Server
An MCP server that integrates Kagi search capabilities with Claude AI, enabling Claude to perform real-time web searches when answering questions that require up-to-date information.

Neon Database
MCP server for interacting with Neon Management API and databases

Exa Search
A Model Context Protocol (MCP) server lets AI assistants like Claude use the Exa AI Search API for web searches. This setup allows AI models to get real-time web information in a safe and controlled way.

Qdrant Server
This repository is an example of how to create a MCP server for Qdrant, a vector search engine.

E2B
Using MCP to run code via e2b.